McCabe-Thiele Diagram
also known as stage diagram · stepping off stages
The McCabe–Thiele construction plots the equilibrium curve together with an operating line whose slope is set by the O/A ratio. Starting from the feed concentration, horizontal and vertical steps are drawn alternately to the equilibrium curve and the operating line; each complete step is one theoretical stage. The number of steps to reach the target raffinate concentration is the theoretical stage requirement.
Why it matters in practice
It converts bench isotherm data into a stage count without a full process simulator, which suits pilot programmes. Where the operating line sits close to the equilibrium curve, small changes in O/A ratio or extractant concentration change the stage count sharply — a useful warning that a design is operating near its limit.
Where this appears on this site
Calculators that use this
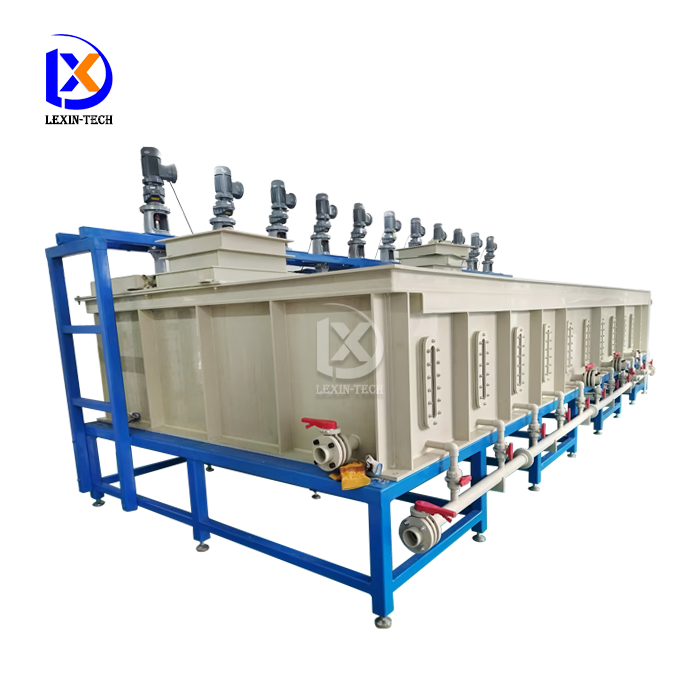
Equipment referenced in this entry
Related terms
Reference entry GL-MCCABE-THIELE-DIAGRAM. Definitions on this page describe engineering practice in hydrometallurgical process design; they are not a substitute for test work on your own material.